How to Use Browser DevTools to Debug Performance Issues
July 3, 2025
When building web applications, you might face performance problems where your website loads slowly or feels unresponsive. This can be frustrating because there are many possible causes: slow JavaScript code, large images, network issues, or coding errors.
Many developers try to fix performance problems by guessing what might be wrong and making random changes. This approach wastes time and often doesn't solve the real problem.
The better approach is to use browser Developer Tools (DevTools) to identify exactly what's causing the performance issues. DevTools are built into all modern browsers and give you detailed information about how your website performs. Instead of guessing, you can see exactly where the problems are and fix them efficiently.
Why DevTools Are Essential for Performance Debugging
Here are two common scenarios that show why DevTools are important:
Example 1: Slow Social Media App
You're building a social media app for a school project. When users click "Post," it takes 5 seconds for their content to appear. Your customers are frustrated, and you need to fix this quickly.
Without DevTools, you would have to guess what's wrong. You might spend hours checking your JavaScript code, server configuration, or database queries. This could take all weekend and you still might not find the problem.
With DevTools, you can open the Network panel and see exactly what happens when someone clicks "Post." You might discover that your app is making 7 separate requests to the server when it should only make one. This gives you the exact information you need to fix the problem in minutes instead of hours.
Example 2: Slow Loading Website
You build a photography portfolio website that looks great, but visitors wait 3 seconds before they can interact with anything. Your first thought might be to compress your images, but what if the real problem is in your JavaScript code?
DevTools' Performance panel shows you exactly what happens during those 3 seconds. Instead of guessing, you get detailed information about where your website is spending time and what's causing the slowdown.
How to Use the Performance Panel?
The Performance panel is the most important tool for finding performance problems. It records everything that happens when your website loads and shows you detailed information about timing and resource usage.
Understanding Browser Lifecycle Events
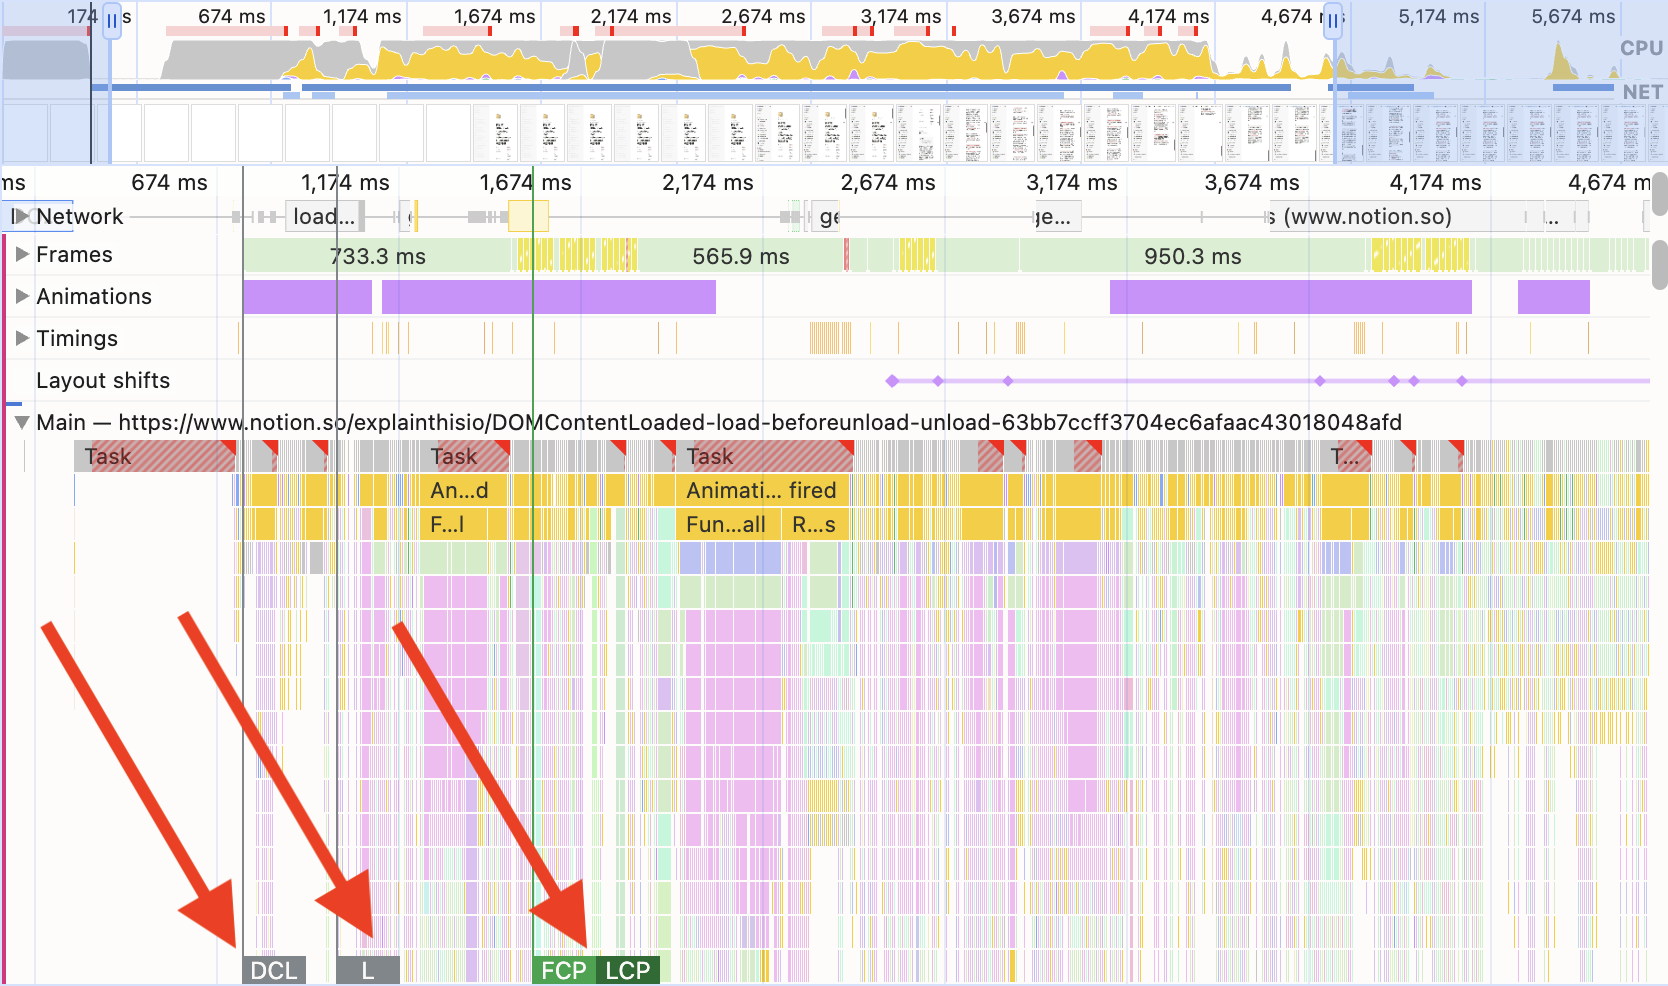
When someone visits your website, the browser goes through several important steps in a specific order. The Performance panel shows you when each of these steps happens:
DOMContentLoaded (DCL): The browser has finished reading and understanding your HTML structure. At this point, the browser knows what elements are on the page, but it might still be loading images, stylesheets, and other resources.
Load: Everything on the page has finished downloading - images, stylesheets, JavaScript files, and all other resources. The page is completely loaded.
Largest Contentful Paint (LCP): The moment when the largest piece of content on your page becomes visible to users. This is usually the main image, video, or text block that users see first.

These timing markers help you identify problems. For example, if DOMContentLoaded takes 10 seconds, you know the browser is having trouble processing your HTML. Common causes include:
- HTML files that are too large or have unnecessary comments
- JavaScript code that blocks the browser from finishing HTML parsing
- Scripts that run too early and should wait until later
How to fix slow DOMContentLoaded:
- Remove unnecessary HTML comments and whitespace
- Move JavaScript code to the bottom of your HTML file
- Use the
deferattribute on script tags to let HTML parsing finish first
Analyzing Function Performance with Flame Charts
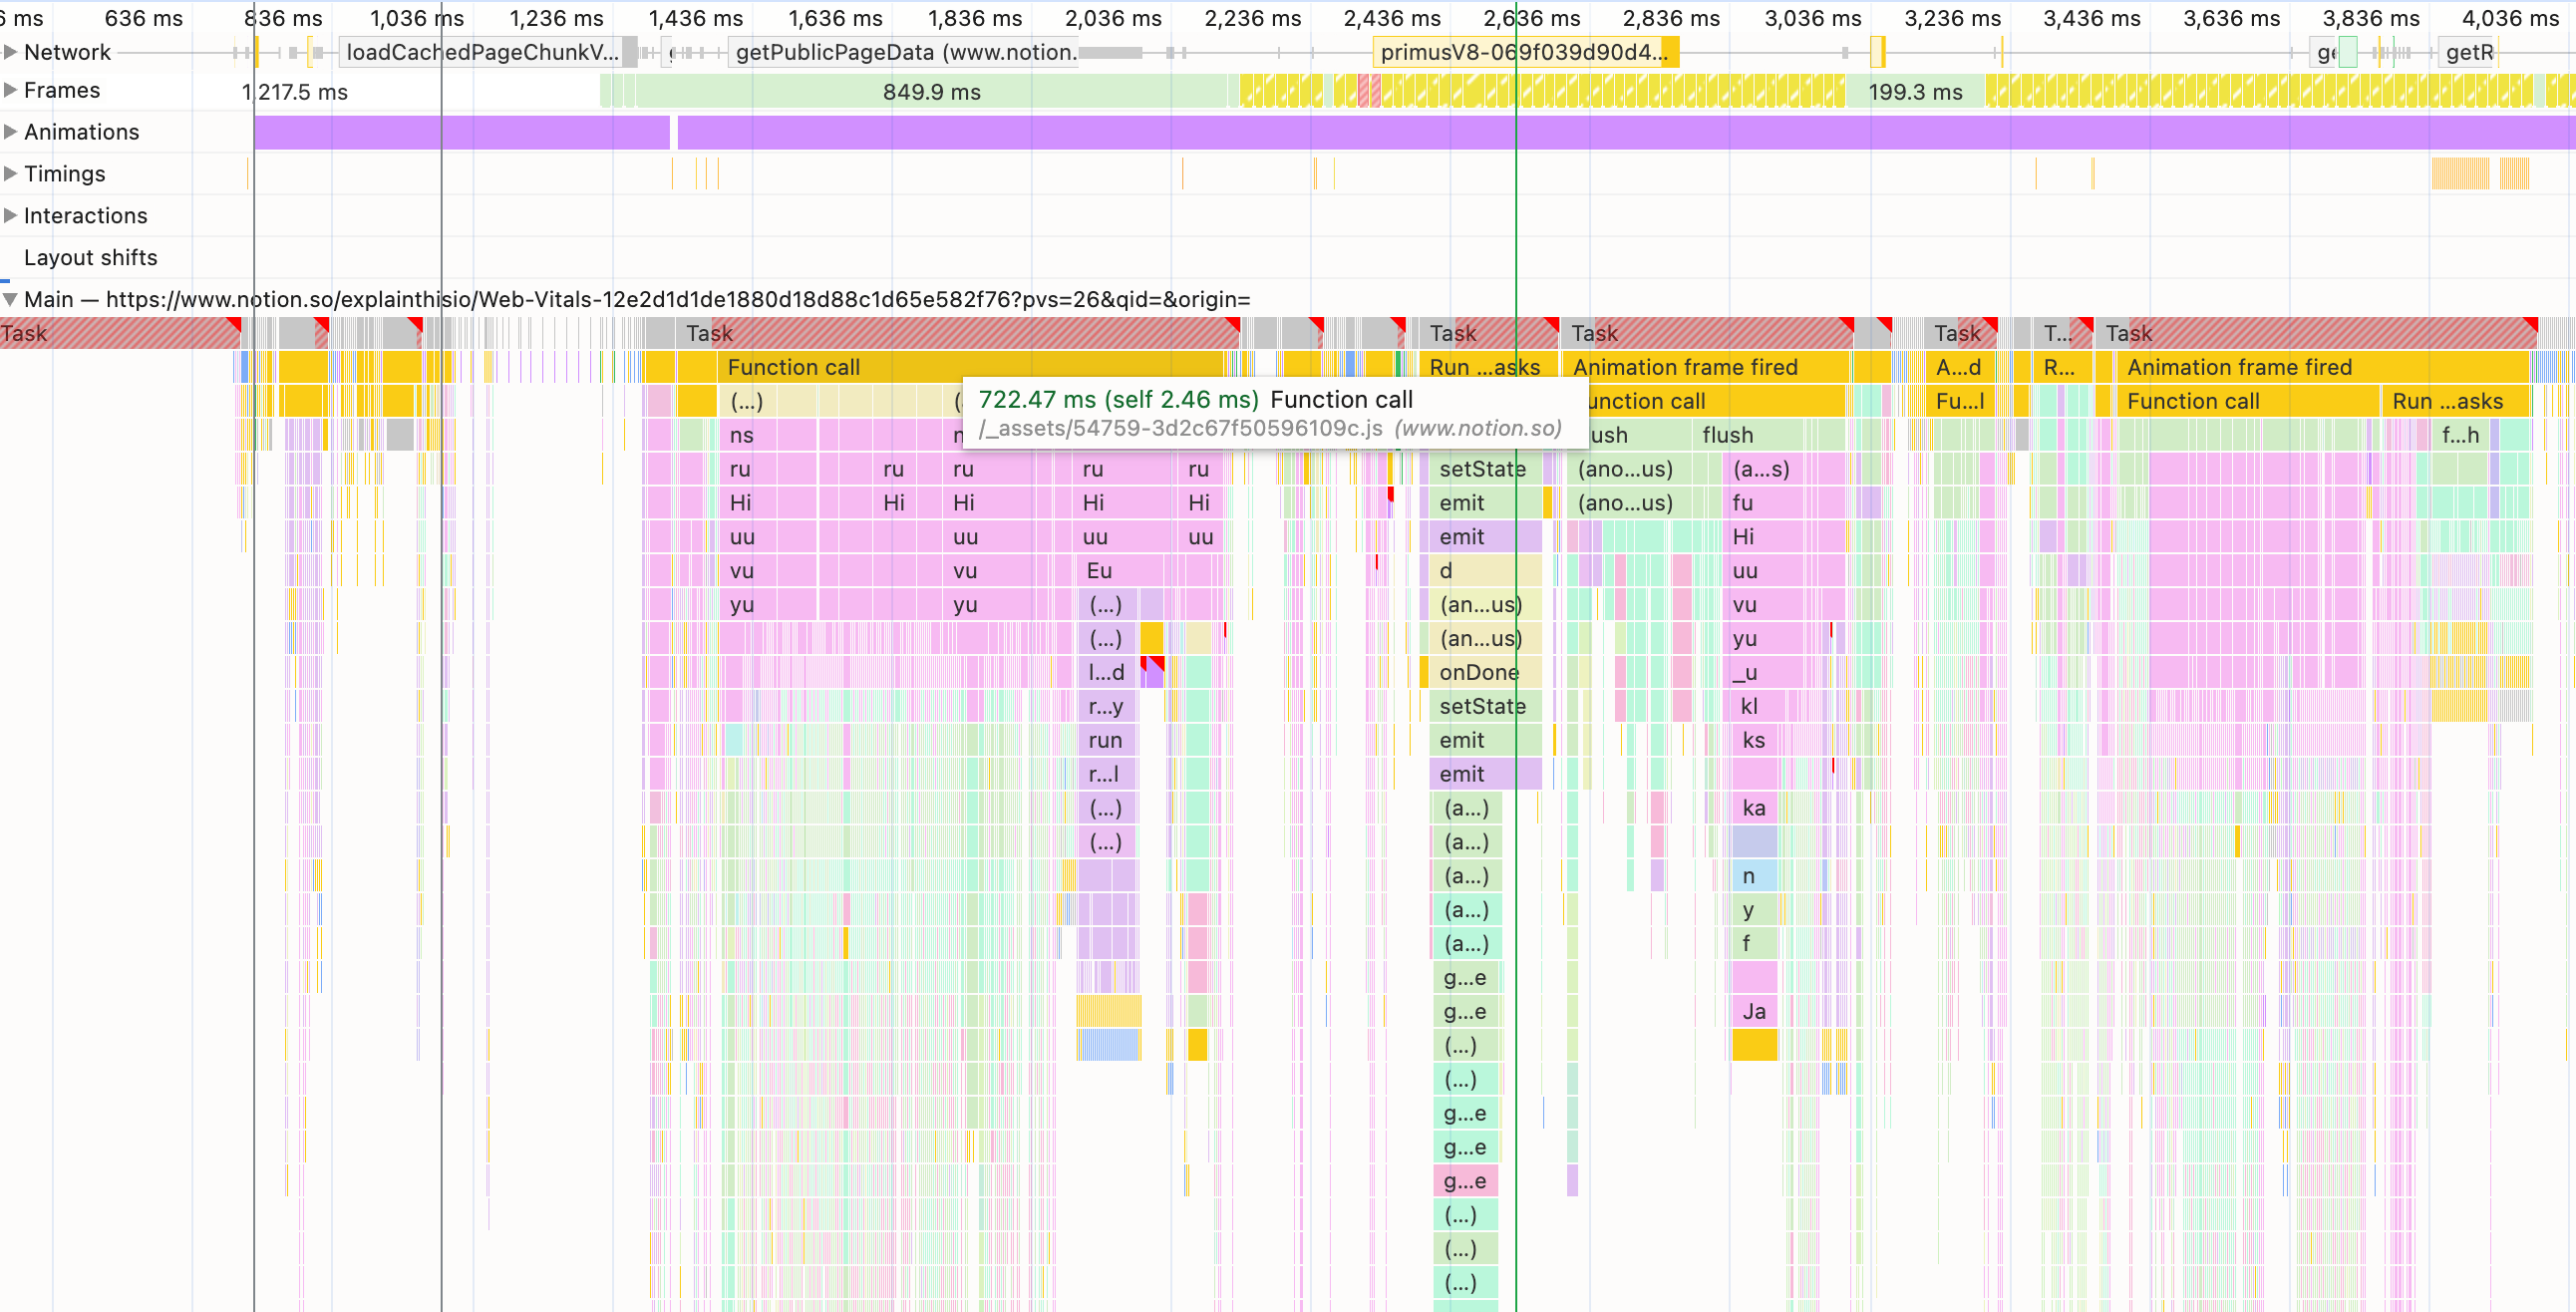
The flame chart shows you exactly which functions are running and how long each one takes. This helps you find which parts of your code are causing performance problems.
Each horizontal bar represents a function call. The wider the bar, the longer that function took to execute. When functions call other functions, they stack on top of each other, showing the call hierarchy.

When analyzing function performance, you need to understand two important measurements:
Total Time: The complete time from when a function starts until it finishes, including all the other functions it calls. For example, if function A calls function B, the total time for A includes the time spent in B.
Self Time: Only the time spent in the function itself, not including the functions it calls. This is the actual time spent executing the function's own code.
Important: Focus on Self Time when looking for performance problems. A function might have a long Total Time simply because it calls many other functions, but if its Self Time is short, the function itself is not the problem.
In the example above, this function has a Total Time of 722.47 milliseconds but a Self Time of only 2.46 milliseconds. This means the function itself is fast, so we don't need to worry too much about it.
Monitoring Main Thread Performance
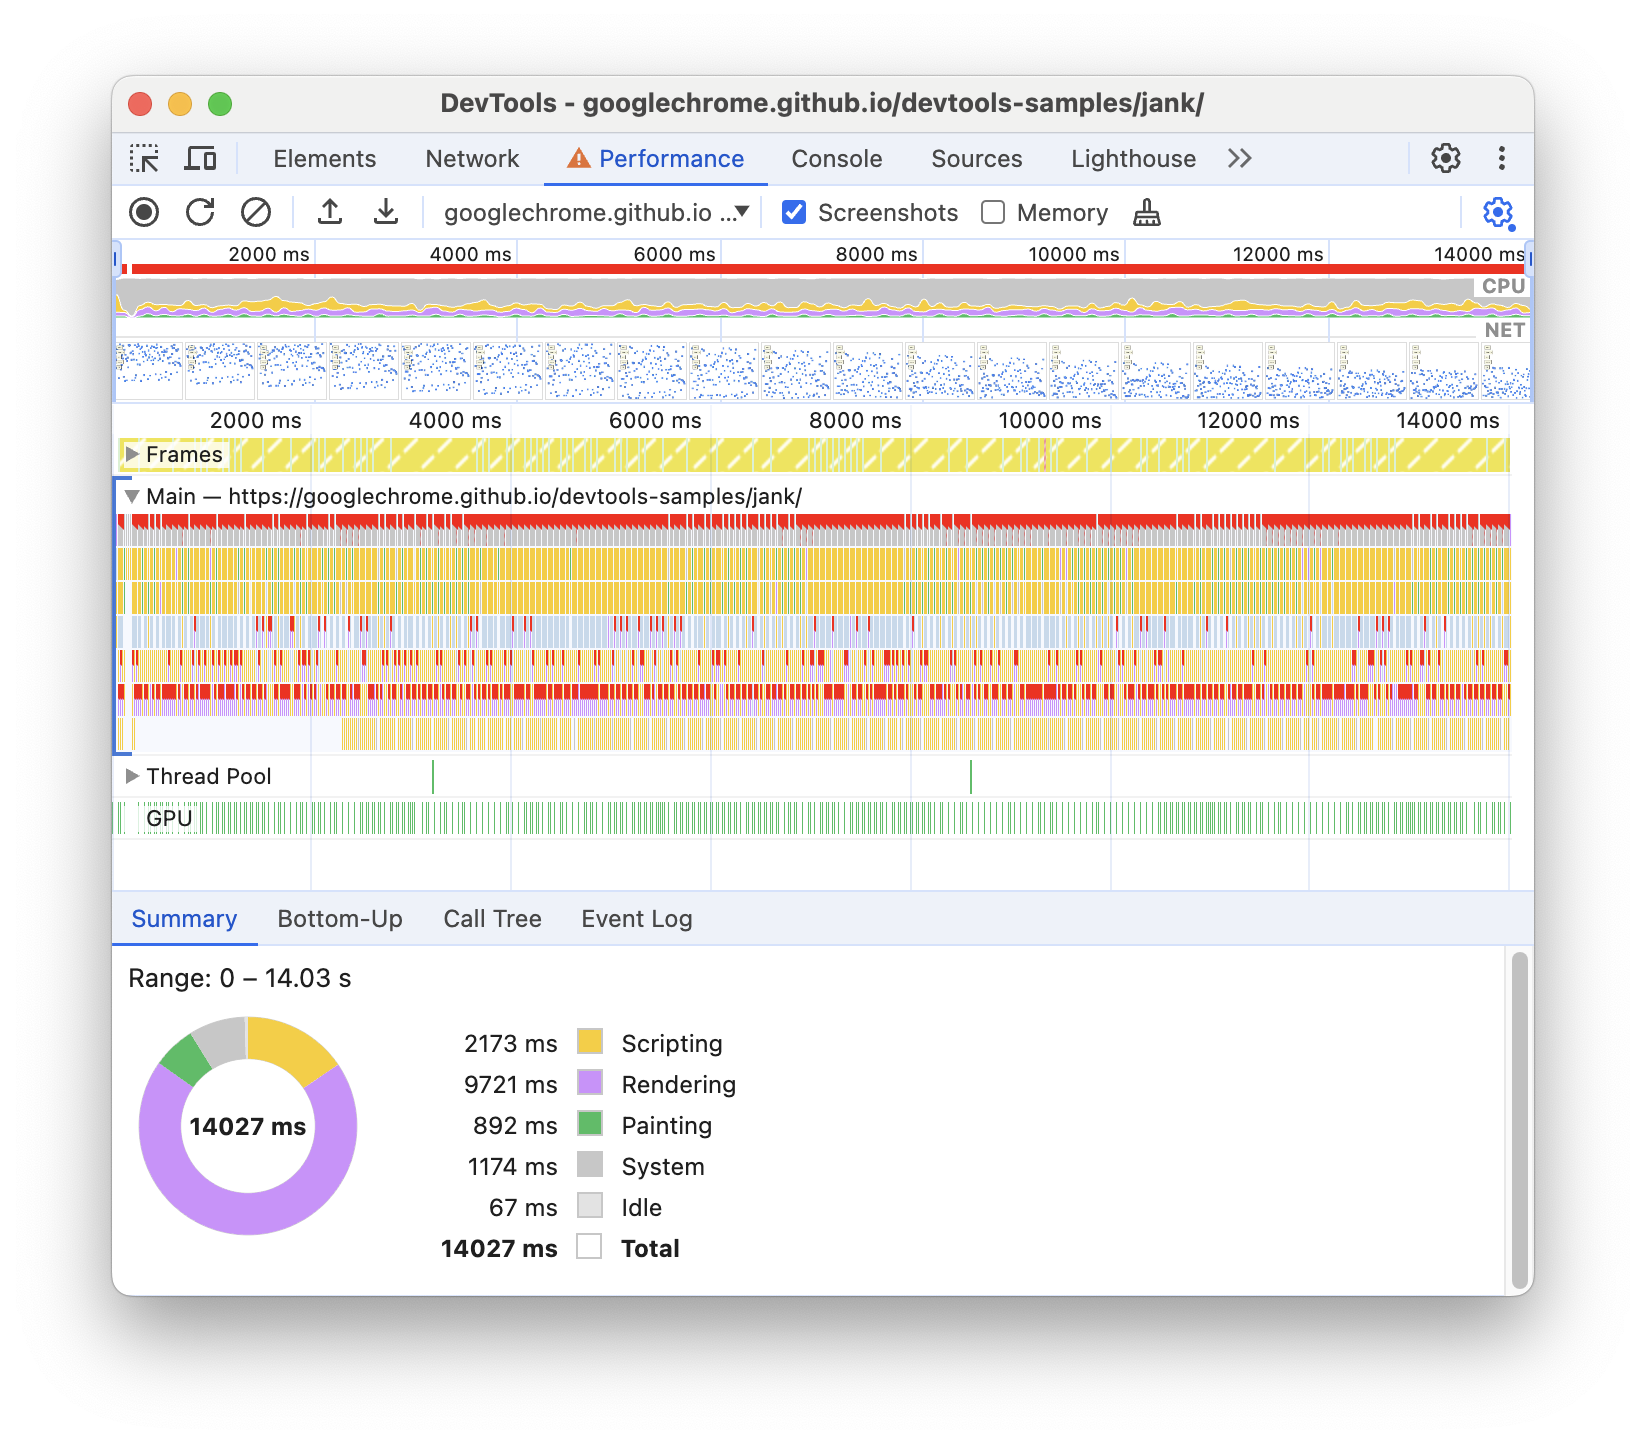
JavaScript runs on a single thread called the "main thread." This thread handles all JavaScript execution, user interactions, and page updates. When the main thread gets overloaded, your website becomes slow and unresponsive.
For smooth user experiences, your website needs to update 60 times per second (60 FPS). This gives you about 16.67 milliseconds per frame. However, the browser needs about 6 milliseconds for its own work, so you have approximately 10 milliseconds per frame for your JavaScript code.

When you see red blocks above the "Main" section in the Performance panel, it means your main thread is overloaded. This causes several problems:
- Scrolling becomes jerky and unsmooth
- Buttons and other interactive elements feel unresponsive
- Animations stutter or skip frames
- The page feels slow and frustrating to use
How to fix main thread overload:
- Break large tasks into smaller chunks that can run over multiple frames
- Use
requestAnimationFrame()to schedule work at optimal times - Move heavy computations to Web Workers (separate threads)
Becoming Better at Performance Debugging
Learning to use DevTools effectively changes how you approach performance problems. Instead of guessing what might be wrong, you can identify the exact cause of slowdowns and fix them efficiently.
The key to getting better at performance debugging is practice. Every time you build a website or web application, take time to examine it with DevTools. Look at the Performance panel even when your site seems to work fine. Study the flame charts to understand which functions take the most time. Monitor your main thread to see if it's getting overloaded.
With regular practice, you'll develop an understanding of what good performance looks like and how to achieve it. You'll be able to spot potential problems before they become serious issues.
Support ExplainThis
If you found this content valuable, please consider supporting our work with a one-time donation of whatever amount feels right to you through this Buy Me a Coffee page.
Creating in-depth technical content takes significant time. Your support helps us continue producing high-quality educational content accessible to everyone.
